The Pools report
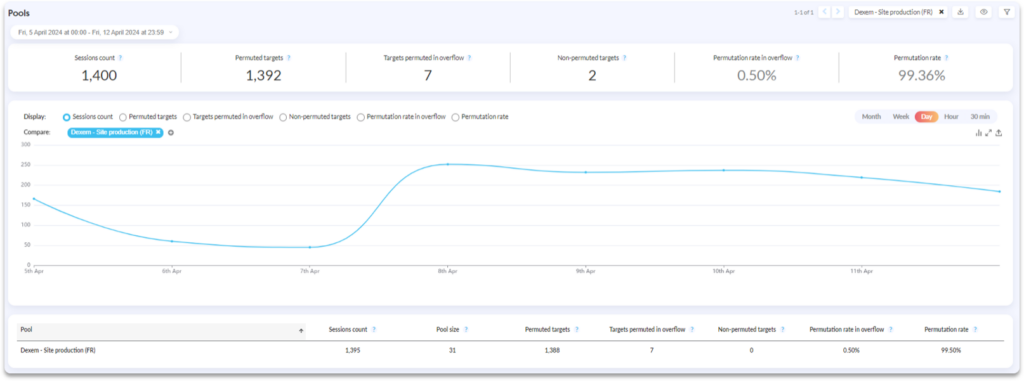
The “Pools” Report displays, over a selected period (which may not exceed 24 months), the distribution of sessions swapped according to each pool of numbers (associated with dynamic tracking numbers per visitor session).
The “Pools” report also displays the following metrics:
- Sessions count
- Pool size
- Permuted targets
- Targets permuted in overflow (visible only when an overflow number is configured)
- Non-permuted targets
- Permutation rate in overflow (only visible when an overflow number is configured)
- Permutation rate
Please note:
The total number of permuted targets and non-permuted targets can exceed the number of unique sessions. A single session may include several permutations.
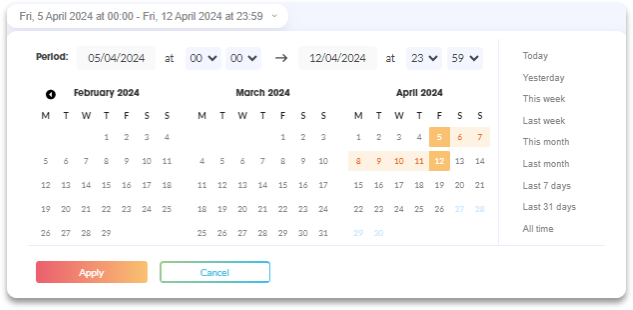
Select a period
To select the period you wish to analyse:
- Click on the period selector on the left above the summary panel;
- Then you can :
- Click on one of the predefined periods: “Today”, “Yesterday”, “Last month”, etc. The desired period is displayed.
- Or select the period of your choice by clicking once on the calendar to set the start date and a second time to set the end date. The selected period is highlighted.
- You can also refine the period by selecting times associated with the start and end dates.
- To confirm your selection, click OK.
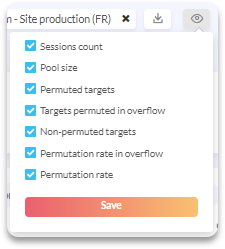
Customize the display of the Pools Report
For more accurate reporting, you can modify the list of key metrics to be included in the Pools Report.
To do this, click on the Customize button in the top right-hand corner.
Select one of the following metrics:
- Sessions count
- Pool size
- Permuted targets
- Targets permuted in overflow
- Non-permuted targets
- Permutation rate in overflow
- Permutation rate
See the peak sessions for a number pool
It is possible to view the single session peaks for a number pool.
To do this, in the “Pools” report, click on the name of the pool you wish to analyze.
A new report will open, displaying a new curve.
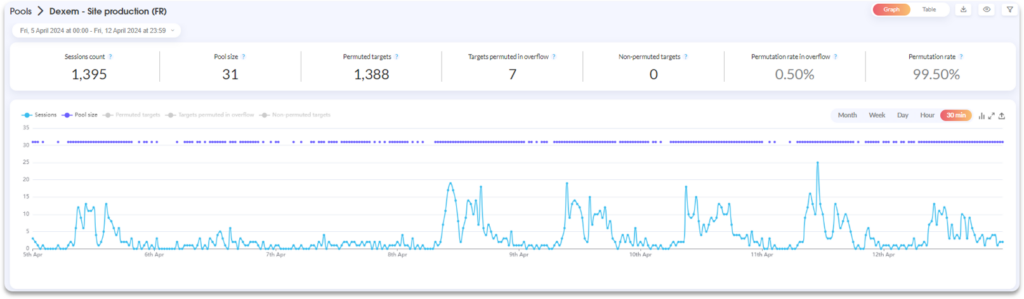
This curve shows the evolution of peak unique sessions relative to the size of the pool.
We recommend that you select a 30-min scale.
This allows you to see the peaks of sessions in the pool and adapt the number of numbers in the pool according to these peaks.
For more information on adding numbers, please contact your sales representative.